Rapid Electrochemical Assessment of Paint
Many coating are still measured by exposing them for months with salt spray. The Rapid Electrochemical Assessment of Paint (REAP) allows within 24 hours to determine the Time To Failure (TTF) by combining different techniques. This section will give you a step by step manual for the REAP, which should enable you to perform your own REAP.
REAP
Rapid is a relative term. This procedure includes an overnight step, which for example for the common spectroscopist will seem like a long time, but for a corrosion scientist it is a rather short amount of time. During this protocol a series of measurements with multiple samples is performed and the long-term stability is extrapolated. Electrochemical Impedance Spectroscopy (EIS) and cathodic disbonding are the central techniques for the Rapid Electrochemical Assessment of Paint (REAP), which allows an estimation of the time to failure.
This description is based on ASTM G01.11 subcommittee on Electrochemical Measurements in Corrosion and more details can be looked up there. REAP was originally suggested in Kending et al, J. Coatings Tech., 1996, 68, p. 39 – 47, which is available through Research Gate.
During this procedure the corrosion potential, the water uptake of the coating and the disbonding rate will be determined. With these three parameters an estimate of the Time To Failure (TTF) can be estimated.
Sample
Before the REAP both samples should have a cured and dried coating. For the measurement itself 0.5 M NaCl solution will be needed. Also two setups will be needed to keep both samples immersed for 24 h.
REAP needs pairs of samples or respectively an even number of samples. Usually a minimum of three measurements is recommended. Half of the samples stay pristine and the other half is scribed. The scribed samples should have a right angle cross with both lines 2 cm long. If you want to make sure you keep to the ASTM standards, you can look up how to scribe a sample in ASTM B117.
You will also need to expose a defined area of the sample to the measuring solution and have it connected to your potentiostat.
Next, the steps in REAP are discussed.
Corrosion Potential
The first parameter that needs to be determined is the corrosion potential Ecorr of the pristine sample, because it is needed for the following measurements. The Ecorr should be measured in a short time after the samples immersion, so we recommend setting up the measurement parameters first before pouring the measurement solution (0.5 M NaCl) into the cell.
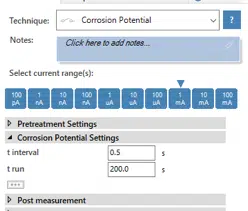
A Corrosion Potential (also known as Open Circuit Potentiometry) is performed with 200 s and one value every 0.5 s. If you don’t know how to perform this measurement with PSTrace, it will be explained in the following paragraph.
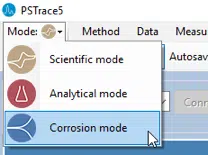
You don’t have to perform this measurement in the Corrosion Mode of PSTrace, although this explanation will assume you are in Corrosion Mode. You can change the mode in the upper left corner of your PSTrace window.
Choose from the techniques list the Corrosion Potential. Please note: If you don’t know what a specific technique does, just choose the technique in the drop-down menu and press the ?-button. You can activate all the current ranges for this technique, so all current ranges should be marked blue. Enter into the field t interval 0.5 s and into t run 200 s.
Position the sample in the measurement solution or position the sample first and then pour the solution in. Make sure there are no air bubbles trapped at the sample’s surface. Connect your potentiostats to counter, reference, and working electrode. Press the Run-button.
After recording the Ecorr you can save it. You can set the dropdown menu next to the Run-button on Overlay, if you want to save all the different measurements performed during your REAP in one pssession file.
There is the possibility that your coating is really good and will behave quite close to a perfect capacitor. As a result you might not get a stable Ecorr, which also shows no trend of reaching a constant potential. While this is inconvenient for our measurements, it means you produced a proper coating. The next steps of the REAP use the measured Ecorr, which is not possible if you can’t measure it. It is suggested that you assume an Ecorr of ‑600 mV.
Determine the Coatings Capacity without Swelling
The goal of this step is to determine the capacity of the pristine sample’s coating. Later the coatings capacity after immersion in water for 24 h will be determined. The change in the capacity is caused by water penetrating the coating. With the two capacities the water uptake can be calculated.
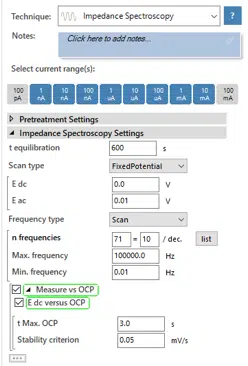
The reference and counter electrode as well as the sample should still be connected from step 1. Change the technique in the drop-down list to Impedance Spectroscopy. Set a t equilibration of 600 s. The drop-down menu should show FixedPotential. If your previous measurement delivered a stable OCP during step 1, you can set E dc to 0 V and check the checkboxes Measure vs OCP and E dc versus OCP below. This way the E dc indicates the potential difference to the OCP.
A short OCP measurement is performed before the EIS measurement to determine the OCP. This measurement will last until the time t Max. OCP is elapsed or until the Stability criterion is met. If you didn’t get a stable OCP, uncheck the checkboxes Measure vs OCP and E dc versus OCP. Try an E dc of ‑600 mV vs SCE, which is now versus the reference electrode. If you don’t know how much this is versus your reference electrode, visit this website.
Set an E ac of 10 mV. Select from as Frequency Type Scan. The Max. frequency of 100 kHz should be sufficient. The Min. frequency is set to 0.01 Hz. Start your measurement (see Figure 7.3). When the measurement is finished, the sample will stay in the solution.
The analysis is done via an equivalent circuit fit, but this will be discussed in step 4, when the second impedance spectrum was acquired.
Disbonding Rate
During disbonding the coating peels of the substrate. The goal of this step is to find the disbonding rate of the coating. This will be measured in distance from the initial scratch per time dx/dt, so how fast does the disbonded area expand.
A proper coating won’t allow disbonding, so we need to use the scribed sample. The pristine sample stays in the NaCl solution for 24 hours, to perform later step 4, so you will need a second setup or at least holder and vessel to keep the sample immersed in the NaCl solution.
The scribed sample would still disbond rather slowly, so this process is accelerated by applying a potential to the scribed samples for 24 h while the sample is immersed in NaCl solution. This potential is very cathodic, so hydrogen will form during the time under this potential. This should increase the rate of disbonding, so the disbonding rate can be evaluated within 24 h.
Prepare a cell with NaCl solution, a reference and counter electrode as well as the scribed sample. Change the technique to Chronoamperometry. Set t equilibration to 600 ms and E dc to ‑1.05 V vs SCE. t interval can be set to 30 s and t run to 86400 s. Start the measurement.
Although the recorded current is not needed to determine dx/dt, we recommend that you save the data for future reference. There is also a correlation between the current and the disbonding rate, so a measurement with a high current should have a high disbonding rate.
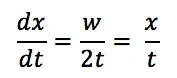
After 24 h take the sample out of the solution and rinse it with demineralized water to prevent further reaction. Dry the sample with a cloth or paper towel. Use a piece of adhesive tape to remove the loose coating around the scratch. Take a sharp object to check, if all loose material has been removed. Use a ruler to measure the width w of the area around the measure as shown in figure 7.4. The border of the disbonded area isn’t always very sharp, so the width should be measured multiple times and averaged. The disbonding rate, so how fast the border between disbonded and proper coating is progressing, can be calculated by taking half the width, which is the distance between the original scratch and the border of the uncoated area x, and divide it by the time t. This is expressed in equation 7.1.
The disbanding rate dx/dt is usually expressed in mm/h, despite being rather in the range of µm/h. These low rates require a very precise ruler to measure the width w.

Determine the Coatings Capacity with Swelling
The pristine sample’s coating will have taken up some water, after the 24 h of immersion in the NaCl solution. To determine this water uptake the coating capacity needs to be determined. This is possible because the water has a very different dielectric constant than the organic compounds in the coating.
The measurement is done similarly to the measurement from step 2. First, the cell with the pristine sample is connected (reference, counter, and working electrode). Then the EIS measurement from step 2 is repeated. If you used the OCP as E dc before, you should use it again. Otherwise, enter the same potential as during the first measurement. If you want you can save the Method file of the measurement from step 2 and just reuse it, so you set up your experiment in an easy way. Just use in the top menu under Method the option Save method and later Load method to load the parameters.
With PSTrace it should be quite easy to determine the coating capacity before and after the 24 h immersion from the two spectra.
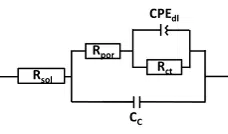
In the chapter Equivalent circuit fitting for corrosion measurements the use of equivalent circuits was discussed thoroughly. For the REAP a model similar to the one in Figure 6.11 has proven useful. Just the capacitor for the substrate solution interface has been replaced with constant phase elements (CPE) to take the non-ideal character of the coating capacitor into consideration. This model is shown in Figure 7.5.
The hints from chapter How to fit easily should be taken into consideration when fitting the data.
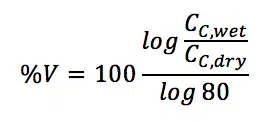
When a satisfactory fit for both curves was achieved the water uptake of the coating in volume percentage %V can be calculated using the capacity before and after immersion. Maybe the CC must be replaced with a CPE as well to achieve a proper fit. The capacity of the CPE has the unit T, but can for this experiment be used in an analog way as a capacity in F. Equation 7.2 delivers %V.
Determine Rcorr
From the fit in step 4 also the corrosion resistance Rcorr, labeled as Rct, can be extrapolated. Just read the value from the fit of the EIS after the 24 h of immersion.
Estimation of the Time To Failure (TTF)
The TTF can be calculated if the corrosion resistance Rcorr, the water uptake in %V and the disbonding rate dx/dt are known. Equation 7.3 is suggested in the literature:

It is visible in equation 7.3 that an increase of Rcorr will increase the TTF, an increase of dx/dt or water uptake %V will decrease the TTF. This equation contains a number of empirical constants based on measurements with mild steel under the same conditions. Other metals might have different constants and it is not entirely clear which other influences might have an impact on these measurements. By using other methods for the TTF estimation and a series of REAP measurements, the constants for other systems could be obtained. This would be an intensive time investment. However, the values obtained from the equation above make it possible to compare two coatings measured under the same conditions.
An intensive discussion of all the REAP’s aspects would exceed the frame of this handbook. If a deeper understanding is required, we recommend looking at the already mentioned publications:
ASTM G01.11